 Application Status Viewer
 Application Status Viewer
The Application Form displays a few additional maintenance links along with some simple statistics about the current state of the application and the system.
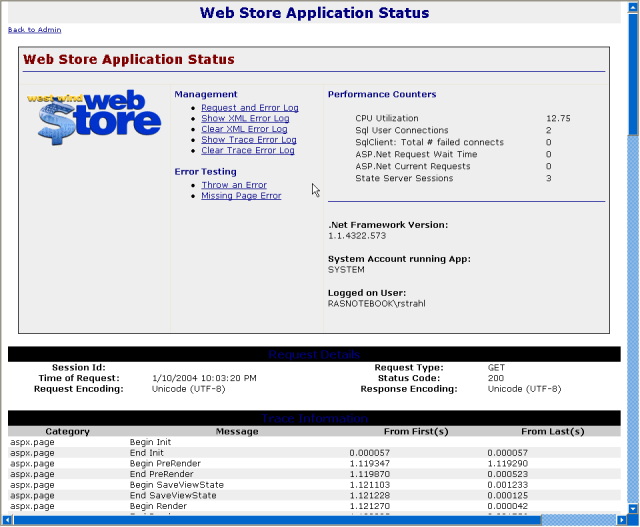
As you can see this form displays
Note that hitting this page can be slow, especially the first time, as it compiles some diagnostics code from the .Net framework.
Request and Error Log
This link takes you to the Request and Error Log form from the same link on the main administration page to allow you to view the request log (if enabled) and error log.
Show and Clear XML Error Log
Error Logging can be sent to a SQL Server database or alternately be set to an XML file. XML is the default, which makes sure that errors are always logged even if there's a problem with the SQL Server. This setting is determined as part of the Web Store configuration. This setting logs to a file in the admin directory called ErrorLog.xml and this link simply displays the content of this XML file.
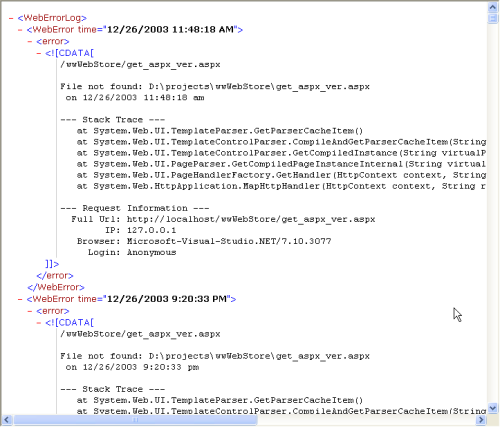
You can also clear the log which simply overwrites the XML log file.
Show and Clear Trace Log
If you decide to you can implement a custom trace log in your application and then use Trace.Write() to output to any trace messages to this file. This link is provided for debugging purposes - I frequently have used to it capture any SQL Connect errors and other SQL related failures which were difficult to trace otherwise. In order to use this feature you first need to enable tracing with an entry as the following in the main web.config file:
<system.diagnostics>
   <trace autoflush="true" indentsize="4">
   <listeners>
      <add name="wwErrorListener" type="System.Diagnostics.TextWriterTraceListener" initializeData="d:\projects\wwWebStore\admin\TraceLog.txt" />
      <remove type="System.Diagnostics.DefaultTraceListener"/>
   </listeners>
   </trace>
</system.diagnostics>
Note that this creates a trace listener object - wwErrorListener - which simply writes the output to a file. The filename must be specified in the initializeData parameter which is passed to the listener's constructor. Once tracing is active any Trace.Write() operation outputs to the trace file. Note that you can't delete the Trace Log once any tracing has occurred as the output file remains locked. You can only delete the trace log after you've disabled tracing in the web.config file. The occasion to enabling tracing should be very rare.
Error Testing
The Error Testing section allows you to see what errors look like as they occur in the application. There are two error options - a hard error (a faked null exception) and a missing page error. Depending on your Configuration setting of the Error display the message will display either an application error message or a detailed developer message.
This link serves to test error operation so you can quickly see what an error looks like in the application and what happens when the error occurs. If you have admin emails enabled you should get an email in response to the error. An entry should also show in the error log. Use this link to understand what happens when an error occurs.
Performance Counters
This section shows several useful performance counter values.
CPU Utilization
CPU Utilization is the total CPU load percentage similar to what you would see in Task Manager. This value is approximate and it varies of course from request to request. If you hit this page multiple times you should be able to get a rough idea of the load level of the server.
SQL User Connections
Shows the number of SQL Connections against the SQL Server. Note this counter only works with a LOCAL Sql or MSDE Server.
Total # of Failed Connections
Shows the number of connection failures that occurred since the system was started. This number refers to .Net SqlClient connections which are independent of either SQL Server or IIS/ASP.Net Host processes, so that this value will not reset after either an IIS or Sql Server restart.
ASP.Net Request Wait Time and Current Requests
This counter displays the current wait in the request queue. Usually this value is 0 or very near it, unless the application is overloaded and starts queing requests. Current Requests shows the currently running simultaneous ASP.Net requests at the time of the snapshot.
State Server Sessions
Shows how many Sessions are currently alive in the State Server Service on the local machine. Useful to get a very rough idea how many people are currently on. Keep in mind that this is very rough as the Sessions are active for 60 minutes (in the Web Store by default - this is configurable in web.config though through the SessionState key).
.Net Framework Version
This value simply returns the current version of the .Net CLR. Useful to make sure that you are actually running the version you think you are.
System Account running App
This option displays the account that is running the application. This will be a system account usually such as ASPNET, NETWORK SERVICE or SYSTEM. This setting corresponds to the rights of the application - this account is the one that accesses all resources. This account is configured in Machine.Config (Windows 2000/XP) or via the IIS Application Pool Identity feature (Windows 2003 Server).
Logged on User
Displays the user that is currently logged on in order to access this maintenance request. This is useful in case you're automatically logged in over an intranet to see which account is actually reaching the application.
Trace Information
This form also includes a full Trace layout which shows all server variables among other things. This information can be useful if you need to find out specific server variable names or other information that is usually stored away in the request. This page can save you enabling trace in other pages.

Comment or report problem with topic